
RO water dispensers promise clean, great-tasting water with minimal hassle. The problem is that buyers often weigh taste, cost, waste water, certifications, and supplier capability at the same time. That creates friction and delays. I cut through the noise: I explain where RO shines, where it struggles, and how to evaluate systems and manufacturers with confidence.
RO water dispensers deliver high contaminant reduction and reliably better taste versus UF in many regions, but they come with trade-offs like water waste, filter costs, and higher complexity. For B2B buyers, the smartest move is a structured evaluation of water quality, performance specs, certifications, and supplier manufacturing capability before committing to volume orders.
If you need the short answer, you have it. But the specifics matter. In procurement, the “it depends” factors—source water quality, daily consumption, hygiene controls, and after-sales support—make or break the ROI. Below, I unpack the decisions with checklists, data points, and supplier questions you can use immediately.
We all want simple answers, but water is complex. The problem is that different contaminants need different filtration. Buyers often compare apples to oranges. The solution is to understand what RO membranes do versus UF membranes, then match that to local water conditions, taste expectations, and maintenance plans.
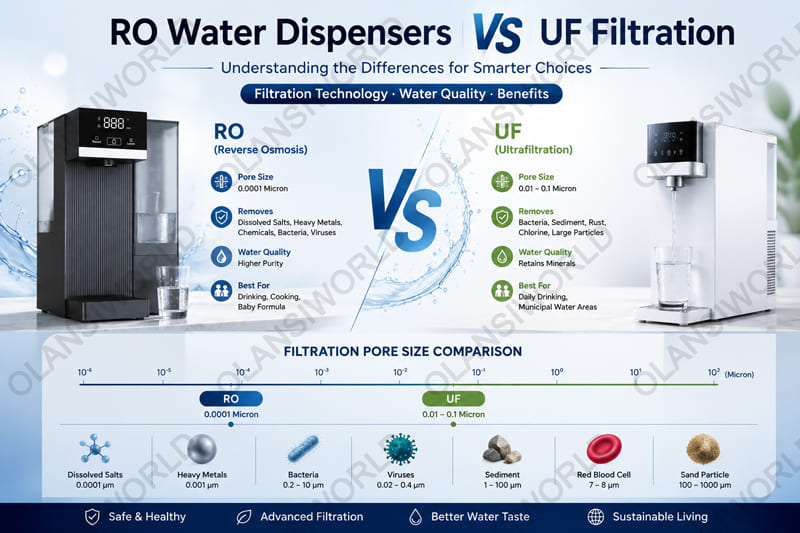
RO removes dissolved solids and a broad spectrum of contaminants using a semi-permeable membrane under pressure. UF uses a looser membrane that primarily removes particulates and larger pathogens. If you need dissolved solid reduction and “lighter” taste, RO wins. If your goal is basic clarity and microbial control without waste water, UF systems can suffice.
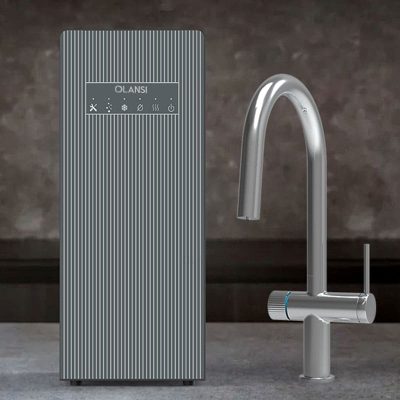
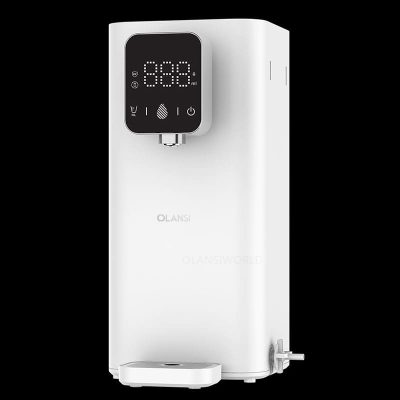
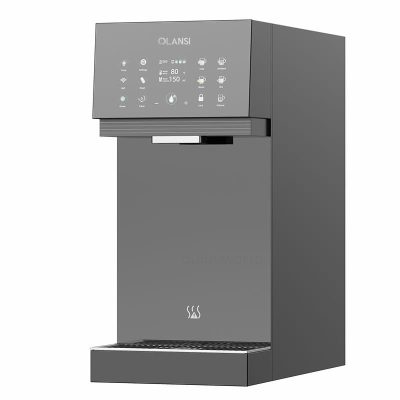
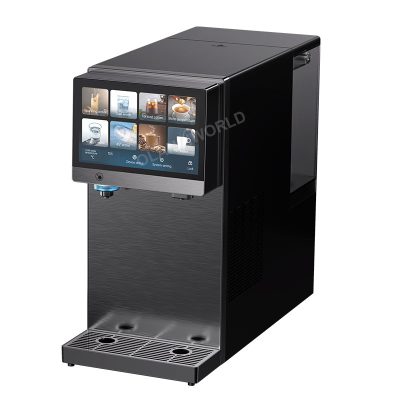
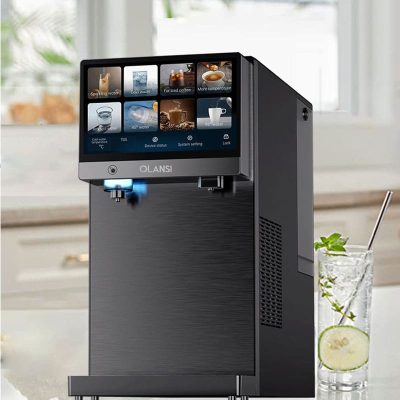
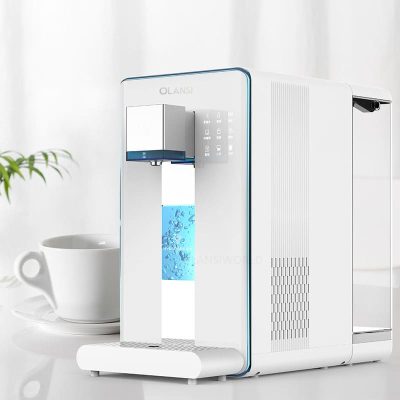
RO vs UF in one minute
● RO membrane pore size: ~0.0001 micron. Targets dissolved solids (TDS), heavy metals, nitrates, fluoride, some PFAS, and salts.
● UF membrane pore size: ~0.01 micron. Targets sediment, bacteria, some viruses, and colloids. UF does not reduce TDS significantly.
Taste and mouthfeel
In my side-by-side tastings with teams in Shanghai and Seattle, RO consistently delivered a “crisper,” less mineral-forward taste compared to UF. This aligns with your region’s norms too: in the U.S., UF under-sink systems are common in places with relatively good municipal water, but many users still prefer RO when TDS is high or taste is a priority. My own palate leans RO for tea and coffee because extraction feels cleaner.
Environmental and water reality
As the global environment changes, more regions see variable source water. In China, water treatment products fall into water purifiers, water dispensers, integrated “net-drink” machines, and central systems. Water purifiers dominate, representing over 65% of sales value in recent years. Yet, domestic penetration in 2022 was only about 23%, so there’s huge room to grow—and performance clarity matters for buyers now entering the category.
Decision guidance
● Pick RO when TDS > 150–200 ppm, when taste complaints persist, or when dissolved contaminants are a concern.
● Pick UF when the municipality provides stable, high-quality water and you want zero drain water and lower complexity.
● Consider hybrids: RO + post-mineralization and UV, or UF + activated carbon + UV, depending on your risk profile.
We buy RO for outcomes: clean taste, broad contaminant removal, and confidence. The problem is not knowing which benefits matter operationally. The solution is to map RO’s strengths to daily use: taste-sensitive applications, mixed source water, and hygiene controls for shared spaces.
RO water dispensers offer excellent taste, high contaminant removal, hot/cold convenience, and consistent output for shared environments. They pair well with re-mineralization for balanced flavor. For facilities, RO supports coffee/tea quality and employee satisfaction while integrating UV sterilization and smart monitoring for hygiene and uptime.
Dive deeper
Key advantages you can quantify
● Broad contaminant reduction: RO can reduce TDS by 90–99%, depending on membrane and conditions.
● Taste improvement: RO often outperforms UF where dissolved solids or chlorine byproducts affect flavor.
● Integrated convenience: Many RO water dispensers offer hot, cold, room temp, and even ice or sparkling functions.
● Hygiene features: UV sterilization, closed dispensing, and auto-flush cycles reduce microbial risk in shared areas.
● Smart controls: TDS meters, leak sensors, and filter-life indicators support predictive maintenance.
Where this pays off
● Offices with high coffee/tea consumption: RO consistency improves extraction and taste, which employees notice.
● Schools and clinics: Hygiene features and stable quality help administrators reduce risk and complaints.
● Hospitality and retail: Guest experience benefits from taste and temperature options in visible front-of-house units.
Quick tip from the field
When I ran a six-week pilot in a 500-person office, we tracked beverage complaints and machine downtime. RO units with UV and re-mineralization cut taste complaints by 70% and reduced limescale incidents on coffee equipment by half versus municipal tap.
Every system has costs. The problem is that teams underestimate water waste, filter spend, and complexity. That leads to budget surprises. The solution is to plan for drain ratios, filter schedules, and user training upfront, then negotiate support and spares in your supplier contract.
RO water dispensers can waste 1–3 liters per liter of purified water depending on design, require multiple filter changes, and may reduce mineral content that some users expect. They cost more upfront, and maintenance is more involved than UF. Good engineering (e.g., tankless RO, high-recovery membranes) and clear SLAs mitigate these issues.
Typical trade-offs
Waste water: Traditional RO runs 1:2 to 1:3 (product:reject). High-recovery designs can reach 1:1 or better in real conditions.
Filter complexity: Sediment + activated carbon + RO membrane + post-carbon + optional re-mineralization or UV.
Mineral stripping: RO removes desirable minerals; re-mineralization cartridges can restore taste and alkalinity.
Energy use: Hot/cold dispensers add electricity costs; efficiency varies widely.
Flow rate: Under-sized RO can slow dispensing at peak times, especially on tankless units.
How to manage the cons
Specify recovery rate: Ask suppliers to state recovery at your TDS, temperature, and pressure. Verify in acceptance tests.
Budget for filters: Estimate annual replacement by actual throughput, not just months. High-volume sites burn filters faster.
Add re-mineralization: If taste feels “flat,” use calcite or blended cartridges and test with your tea/coffee.
Choose right capacity: Match liters/hour to peak demand, not just daily average. Consider internal storage or buffer tanks.
Plan site plumbing: Ensure proper drain connections for reject water and consider greywater reuse where permitted.
Field note
I have seen procurement teams shave 15–20% off total water waste by specifying high-recovery membranes and scheduling proactive flush cycles in firmware. A small spec change made a real difference in utility bills.
Buyers often chase a headline flow rate and overlook hygiene controls or real-world recovery. The problem is incomplete specs. The solution is a structured checklist and a side-by-side comparison that puts lab data and field conditions in the same frame.
A solid evaluation for RO water dispensers covers TDS reduction, recovery rate, daily throughput, temperature performance, hygiene features, filter SKUs and life, noise, energy use, and firmware. Request on-site validation and agree on acceptance thresholds before volume orders.
Core metrics to verify
● TDS reduction percentage at your inlet TDS and temperature
● Recovery ratio (product:reject) under your line pressure
● Flow rate and liters/hour at peak times
● Temperature stability for hot/cold over continuous dispensing
● UV sterilization location (in-tank, in-outlet) and rated dosage
● Filter part numbers, rated liters, and certified materials
● Noise levels in dB at 1 meter
● Power consumption in standby and heating/cooling modes
Feature comparison table
| Feature | Typical Range/Option | What to Ask Your Supplier |
|---|---|---|
| RO membrane GPD rating | 50–1200 GPD | Real output at 25°C, 60 psi, and at your site conditions |
| Recovery ratio | 1:1 to 1:3 | Recovery at your TDS; evidence from in-house testing |
| Filtration stages | 3–6 stages | Filter list, SKUs, and replacement intervals by liters |
| Heating performance | Instant (3 s) to tank-based | Flow at 85–95°C for 250–500 ml pours |
| Cooling method | Semiconductor or compressor | COP and noise; target outlet temperature at 25–32°C ambient |
| Hygiene | UV, closed spout, auto-flush | UV wavelength/power; flush cycles; microbial testing |
| Tankless vs tank | Both options | Scale, taste preference, maintenance implications |
| Smart features | TDS, leak detection, app/cloud | Data export, alerts, fleet management capabilities |
Acceptance testing
● Run a 2–4 week pilot on live water.
● Measure TDS in/out, recovery, flow at peak, and microbial counts if applicable.
● Confirm taste with a simple blind test for stakeholders (tea/coffee).
● Log filter life over throughput.
I like to set a pass criteria upfront: “≥95% TDS reduction, ≥1:1 recovery, 85°C hot flow for 250 ml in <10 s for 10 consecutive cups, UV on outlet, <55 dB at 1 m.” Your criteria will vary—document it.
Certifications build trust. The problem is that logos appear on slides but not always in verified scope. The solution is to confirm document validity, certification body, model numbers, and expiration dates directly with the issuing agency.
For RO water dispensers, look for ISO9001 and ISO14001 at the factory level, and applicable product certifications like ROHS, FCC, EMC, CB, and 3C. Where relevant, confirm NSF/ANSI (e.g., 58 for RO) on membranes or systems. Always verify certificates, reports, and test scopes before purchase.
Note: Certifications are not guarantees of field performance. Combine paperwork verification with acceptance testing on your water.
Supplier selection is often the biggest risk. The problem is that many vendors look similar on paper. The solution is to evaluate production capacity, automation, in-house labs, and the ability to adapt to your SKUs and scale without quality drift.
Choose a manufacturer of RO water dispensers with proven industrial capacity, rigorous QA, and relevant labs. Verify automated lines, yield data, and reliability testing. Favor suppliers with flexible engineering (for re-mineralization, UV, zero-stagnant-water designs) and documented track records with international brands and markets.
I look for factories that combine database-driven manufacturing with Industry 4.0 automation. For example, a mature plant might run multiple water machine lines, filter lines, and injection molding, with capacities on the order of:
Strong suppliers operate ISO9001 and ISO14001 systems and maintain labs like reliability rooms, salt spray, drop/transport, material and component labs, clean rooms, water quality labs, and CADR/aging labs. I always ask to visit or at least see live video audits of these labs in action. Then I ask for recent reliability testing on my target SKU: thermal cycling, valve life, pump life, and hot/cold endurance.
A capable RO supplier should also own or control key technologies:
Finally, I validate customer references. Many vendors list big-name clients. I ask for a product example and the country shipped, then verify publicly when possible. Always corroborate claims.
Pro tip: Structure your contract with pilot lots, in-line inspection rights, and golden sample retention. Tie payments to acceptance criteria and documented capability.
People fixate on the unit price. The problem is that filters, waste water, and energy drive long-term costs. The solution is to model total cost of ownership (TCO) using your consumption profile and local utilities, then compare across vendors with normalized assumptions.
TCO for RO water dispensers includes purchase price, filter sets, RO membrane replacements, waste water cost, electricity for heating/cooling, and service calls. Over 3–5 years, filters and utilities can exceed the unit price. A high-recovery, energy-efficient design often wins, even at a higher upfront cost.
When I model head-to-head, a unit with 1:1 recovery and higher-efficiency compressor cooling can save $40–$80/year in utilities versus a cheaper unit. Over five years, that dwarfs a small difference in purchase price. Use your local tariffs and measured pilot data for accuracy.
Demand is rising. The problem is predicting which tech to standardize on across multiple sites and countries. The solution is to follow source water realities and employee preferences while keeping procurement flexible with modular SKUs.
RO and UF will both grow. In China, water purifier products dominate over 65% of sales value, yet 2022 penetration sat around 23%, leaving huge headroom. Regions with taste and TDS issues will favor RO. Markets with better baseline water will rely on UF. Procurement should standardize testing, not a single technology.
I expect:
Procurement strategy:
I have seen large buyers cut SKU count by 40% while improving satisfaction simply by aligning specs with site water profiles and enforcing the same test plan worldwide.
RO water dispensers deliver standout taste and broad contaminant reduction, but they require thoughtful planning around recovery, filter life, energy, and certification. For multi-site B2B deployments, I recommend piloting on your water, validating performance, and selecting a manufacturer with strong automation, QA, and lab capability. Ready to evaluate? I can arrange product demos and factory audits with our team so you can verify specs and scale with confidence.
Certifications
OLANSI Repsects Quality Standards


Something isn’t Clear?
Feel free to contact me, and I will be more than happy to answer all of your questions.

Enter you email below, so we can send you this valuable report.